
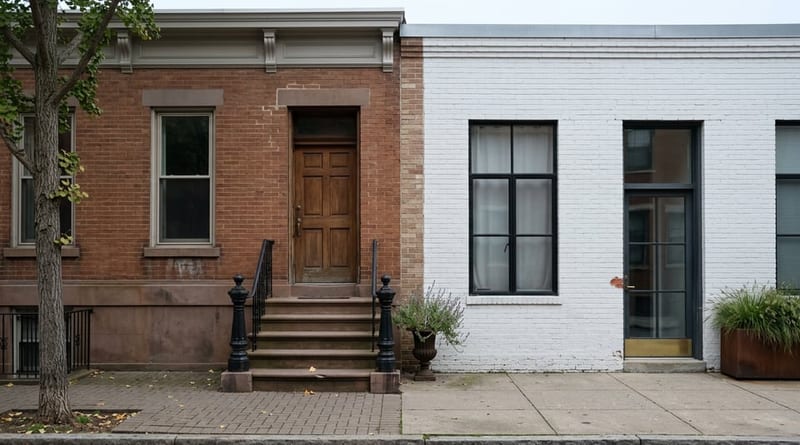
Ask three sources what a home in Greenpoint costs right now and you will get three different answers, all describing the same neighborhood, all covering overlapping windows of 2026. Redfin's three-month read ending in May puts the median sale price at $2.1 million, up 59.2 percent from a year earlier. PropertyShark's Q2 figure lands at $1,439,800, up a comparatively modest 12 percent. PropertyShark's own April snapshot of condo sales alone shows $1.6 million, up 34.6 percent. None of these numbers is wrong. All of them are measuring a market too thin to produce a stable headline.
If you are comparing Greenpoint to Williamsburg before you write an offer, the gap between these figures matters more than any single one of them. It tells you something the portals will not: the "median price" you are reading is only as reliable as the number of sales behind it, and in Greenpoint that number is small enough to swing wildly on a handful of closings.
The Same Season, Three Different Medians
Redfin counted just 20 homes sold in Greenpoint in May 2026, down from 50 in the same month a year earlier. That is not a typo, and it is not a sign the neighborhood stopped selling. It is a sign that a market this size can be moved by a single week of closings at the right building. When only 20 transactions define a monthly median, three or four sales at $2.5 million or higher can drag the whole figure up by hundreds of thousands of dollars, even if every other home on the block sold for what it sold for last year.
Here is the detail that gives it away. Over that same three-month window, Redfin's median price per square foot in Greenpoint actually fell 7.9 percent year over year, even as the median sale price climbed 59.2 percent. Price and price-per-square-foot moving in opposite directions is not appreciation. It is a mix shift. Larger homes, the kind with more total square footage and therefore a lower price on a per-foot basis, made up a bigger share of what closed. A handful of multi-family brownstones closing in the same month as a few smaller condo resales will pull the median up sharply while doing nothing to prove the market is worth more per square foot than it was last spring.
A median built on 20 sales is not a market signal. It is a coin flip that happened to land on a specific week of closings.
Where the Volume Comes From
Greenpoint's transaction count moves in bursts because so much of its recent condo inventory delivers in bursts. Greenpoint Landing, the 22-acre waterfront development along the East River, has brought its buildings to market in phases rather than a steady drip. One Blue Slip, a 30-story tower with 349 rental units designed by Handel Architects, opened in August 2018. Two Blue Slip followed with 421 units in a 40-story tower. The Dupont, at 16 Dupont Street, opened to residents in November 2024 with 266 market-rate and 115 affordable apartments and interiors by Workstead. Eagle + West, the OMA-designed pair of towers with interiors and landscaping by Marmol Radziner, sits along the same esplanade. A separate project, The Huron at 29 Huron Street, launched its pricing page with two towers designed by Morris Adjmi Architects.
Every one of those buildings represents dozens or hundreds of units that can close within a tight window once a certificate of occupancy comes through. When that happens in a neighborhood where the entire monthly resale count is in the teens or twenties, the arrival of one new building's closings does not nudge the median. It resets it. Buyers reading the headline number without asking what generated it are effectively pricing their offer against a statistical accident.
Williamsburg's Deeper Bench
Williamsburg tells a calmer story mostly because there is more of it to measure. Redfin counted 115 homes sold in Williamsburg in May 2026, nearly six times Greenpoint's count and up from 68 the year before. Over the three months ending in May, the median sale price came in at $1.4 million, down 7.2 percent year over year. But the median price per square foot rose 9.0 percent to $1.63 thousand over the same period.
That is the same mix-shift signature as Greenpoint, just running in the opposite direction. A falling median alongside a rising per-foot number usually means smaller units are making up more of the sales mix, not that value is dropping. Studios and one-bedrooms near the Smith-Gray Building's loft conversions or the blocks surrounding the Domino Sugar Refinery redevelopment corridor can pull the median down even while every comparable unit is worth more than it was last year. Williamsburg's larger sample size does not make it immune to this effect. It makes the effect easier to see and correct for, because 115 transactions average out noise that 20 transactions cannot.
Homes in Williamsburg also moved faster, closing after a median of 48 days on market compared with 83 days a year earlier. Greenpoint's days on market barely moved, ticking up to 55 from 53. Liquidity, not just price, separates these two markets right now.
Same Season, Four Different Numbers
Source What it measured Time window Reported figure PropertyShark Median sale price, all home types Q2 2026 $1,439,800 (up 12% year over year) PropertyShark Median condo sale price April 2026 $1.6 million (up 34.6% year over year) Redfin Median sale price, all home types 3 months ending May 2026 $2.1 million (up 59.2% year over year, on 20 May sales) Redfin Median price per square foot 3 months ending May 2026 $1.5 thousand (down 7.9% year over year)Every figure in that table describes Greenpoint during overlapping spring 2026 months. The spread between $1.44 million and $2.1 million is not measurement error. It is what happens when a market's monthly sample size is small enough that the mix of what happened to close, rather than what the neighborhood is actually worth, drives the headline.
Pricing the Deal Instead of the Headline
None of this means Greenpoint data is useless. It means the neighborhood median is the wrong tool for pricing an individual transaction. A buyer or seller needs a comp set built from property type and building vintage, not a borough-wide or even neighborhood-wide average.
A few checks before anchoring to any number you see:
- Ask how many sales built the figure. A median from 20 transactions swings on outliers. A median from 100-plus is more durable.
- Compare price and price-per-square-foot together. If they move in opposite directions, you are looking at a mix shift, not a real change in value.
- Separate condo, brownstone, and co-op comps. A condo at Eagle + West and a pre-war brownstone off Manhattan Avenue are not competing for the same buyer, and blending their sale prices into one median tells you nothing useful about either.
- Weight recent closings in the specific building or block over the neighborhood-wide figure. Greenpoint Landing's phased deliveries mean the right comp might be three units in the same tower, not the whole zip code.
Two Forces Still Reshaping Both Sides of McCarren Park
Greenpoint and Williamsburg share more structural history than their diverging headlines suggest. Both waterfronts were rezoned together in 2005, the same rezoning that made Greenpoint Landing's mix of market-rate and affordable towers possible in the first place. Buildings like 7 Bell Slip and 33 Eagle Street were built as part of that same policy, which is part of why the architecture on both sides of McCarren Park, brick masonry piers, black metal window framing, oversized casement windows, reads as a shared design language rather than two separate markets.
The next phase of construction is already financed. A joint venture led by Park Tower Group secured $114 million, including an $81 million senior loan from Bank OZK, to build three more residential towers at 21 Freeman Street, 37 Freeman Street, and 209 West Street, adding more than 1,000 mixed-income apartments and roughly 20,000 square feet of retail space that Igloo is set to lease, according to reporting from Multi-Housing News and the Brooklyn Eagle. When those units deliver, expect another round of headline distortion, the same pattern that has already played out with One Blue Slip, the Dupont, and Eagle + West.
On the rental side, the FARE Act has changed who pays the broker fee on agent-listed apartments since it took effect in August 2024, shifting that cost from tenant to landlord in most cases and tightening the supply of agent-listed units across the city, Greenpoint and Williamsburg included. If you are renting rather than buying, that shift, not the sale-price headlines, is the more relevant market fact for your search.
A Few Direct Questions
If the numbers disagree this much, which one should I trust when I make an offer? None of them, at the neighborhood level. Build your comp set from recent closings in the same building type and, where possible, the same building. A tower with a known closing schedule, like Eagle + West or The Dupont, gives you a cleaner reference point than any blended neighborhood median.
Does this same distortion affect asking rents, not just sale prices? It can, though rental volume is typically higher than sale volume in both neighborhoods, which smooths some of the noise. The bigger rental-side factor right now is the FARE Act's fee shift, which has changed listing behavior independent of price trends.
When will the next round of Greenpoint median swings hit? Watch the delivery schedule at Greenpoint Landing's next phase on Freeman and West Streets. New buildings closing in bulk is exactly the mechanism that produced this spring's numbers, and it will happen again whenever the next tower reaches occupancy.
Numbers this noisy are exactly where a second set of eyes earns its keep. If you are weighing a purchase in Greenpoint or Williamsburg and want a comp set built from the right buildings rather than a headline median, Byson Real Estate Co. can walk through the actual transaction history with you. Speak with a Byson advisor before you anchor an offer to a number that might not survive next month's closings.